
.png)
.png)

.png)
Article
AI Chat vs Live Chat for Tourism Operators: Which Is Right for Your Business?
A guide comparing AI chat and live chat for tour operators — and why most are choosing both.


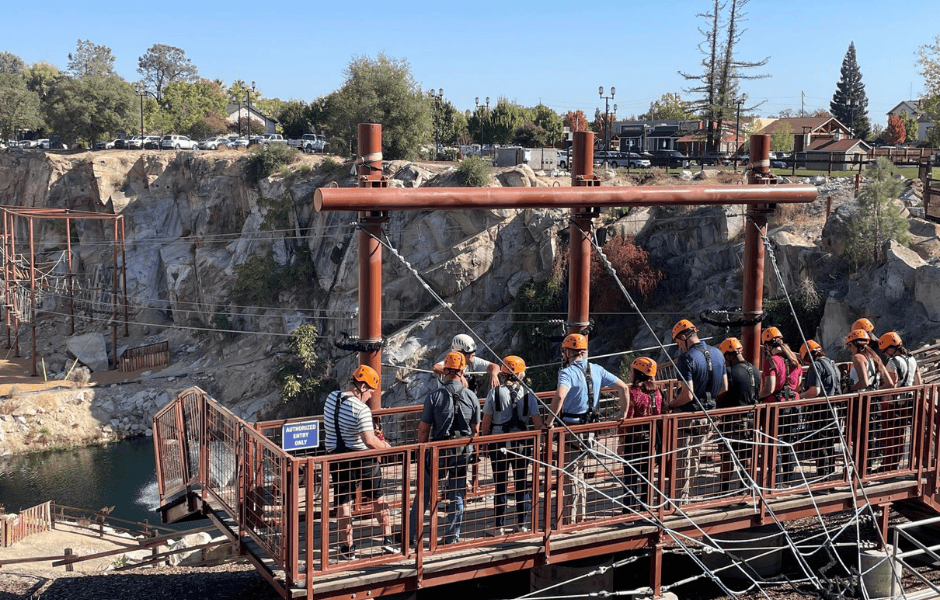
Chat data released today by Yonder, shows a marked increase in enquiries to New Zealand tourism operators from would-be Kiwi and Australian travellers.
“After hitting rock bottom, there has been a 3x increase in New Zealand based traffic over the last four weeks, and the data shows another spike of 2-5x increase in the 24 hours (depending on the sector) since the level two announcement,” explains James Donald, Yonder co-founder.
“In terms of regions, enquiries to those tourism businesses based in Rotorua, Taupo and the Waikato are up more than other areas, presumably as drive-to travellers from the populous areas around Auckland are travelling.”
Talk of a possible trans-Tasman bubble appears to be fuelling interest from Aussie travellers as well, he says.
“Enquiries from Australian-based visitors are up two times, compared to four weeks ago.
“Analysis of chat data shows that questions like "Hey, will you guys be opening for level 2?’ and ‘I’m just wondering if you guys have an idea of when you guys will be reopening?’ are becoming more common as people begin to dream and plan their next trip.
“Interest in things to do seems to be greatest, and the data shows that there has not been as much interest in accommodation yet. Perhaps, because people are just planning day trips from home to see something different than what’s in their backyard.
“The data confirms what some of our customers are telling us about seeing a growth in interest. One business told us: ‘We had five enquiries within 10 mins of the government announcement about moving to level two on Monday.’
“The trends in the data are promising and provide some confidence to those in the sector considering whether to open under level two.
“We’ll keep updating the barometer over coming weeks, as it is a useful leading indicator of a rebound in tourist numbers.”
The data and graphics for this analysis are drawn from Yonder's Tourism Rebound Barometer.


.png)


